Apple Stock: China Problem Now, US Problem Next? (NASDAQ:AAPL) – Technologist
husayno
When looking at Apple Inc. (NASDAQ:AAPL), analysts on Wall Street are rather bullish about Apple, while analysts here on Seeking Alpha are less optimistic. I also have been rather cautious about Apple in the past and in my previous articles I rated the stock as a “Hold”. But obviously I was wrong about the stock and since my last article, Apple returned about 32% and outperformed the SP& 500 (SPY), which increased 25% in the same timeframe.
Apple Analysts Rating (Seeking Alpha)
In the following article, we are looking at the past performance of Apple, the last reported results and are also trying to answer the question if the economic situation in China and the United States could be a threat for Apple.
Great Performance In The Past
And although I was not so optimistic about Apple in my past articles and always rated the stock as a “Hold” and was always cautious about the future performance, I must admit that Apple performed great in the last few years – and it doesn’t really matter what timeframe we take.
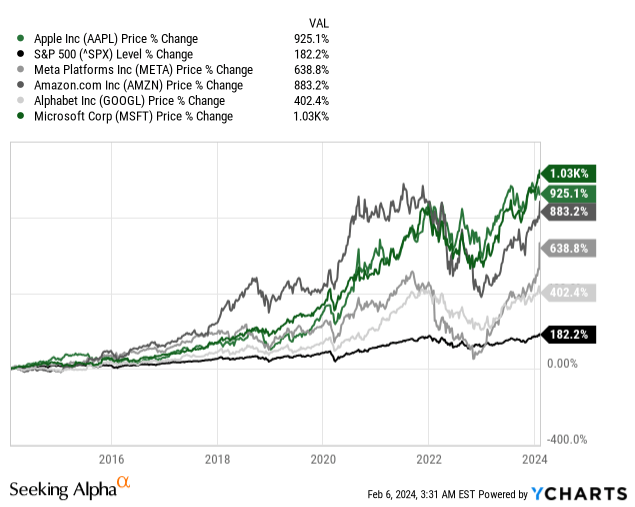
When looking for example at the stock in the last ten years, Apple’s stock price increased 925% and not only can we see a clear outperformance of the S&P 500 (which increased 182% in the same timeframe – an already great performance), but Apple was actually performing better than many of its large cap technology peers. Only Microsoft (MSFT) performed better among the major information technology stocks. When looking at the Magnificent 7, Tesla (TSLA) would have also performed better than Apple, but unless the company from Cupertino will finally introduce its own car, they are not really competitors.
|
Apple |
Amazon.com (AMZN) |
Alphabet (GOOG) |
Meta Platforms (META) |
Microsoft |
|
|---|---|---|---|---|---|
|
Revenue 10-year CAGR |
8.41% |
22.68% |
17.78% |
32.86% |
10.53% |
|
Revenue 5-year CAGR |
7.61% |
19.80% |
17.57% |
19.29% |
13.94% |
|
Operating Income 10-year CAGR |
8.84% |
47.72% |
19.69% |
32.50% |
12.71% |
|
Operating Income 5-year CAGR |
10.02% |
24.30% |
21.84% |
13.42% |
20.35% |
|
EPS 10-year CAGR |
15.75% |
58.22% |
19.79% |
37.85% |
14.14% |
|
EPS 5-year CAGR |
15.54% |
23.56% |
21.56% |
14.46% |
35.36% |
And when looking at fundamental metrics, Apple is lagging many of its peers, but the reported growth rates are still great, and many companies won’t be able to achieve similar growth rates.
First Quarter Results
Last week, Apple reported first quarter results for fiscal 2024 and the company could beat analysts’ expectations for the top and bottom line. While revenue exceeded expectations by $1.34 billion, the company could beat earnings per share by $0.07.
Apple Q1/24 Earnings Release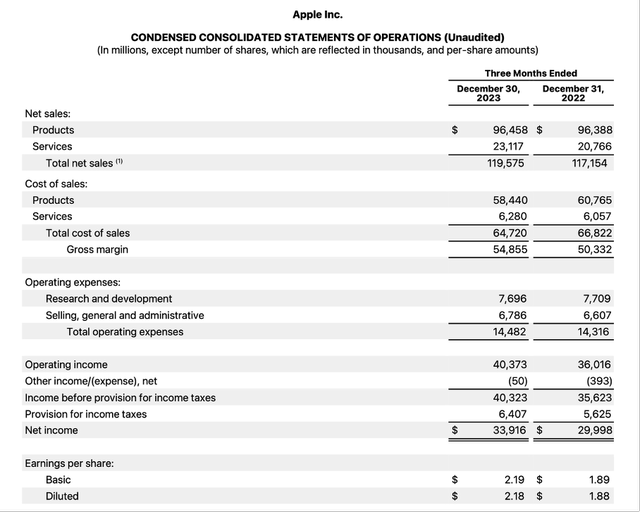
And when looking at the results, they were certainly not bad but not great either. Total sales increased slightly from $117,154 million in Q1/23 to $119,575 million in Q1/24 – resulting in 2.1% year-over-year growth. Operating income, on the other hand, increased 12.1% year-over-year from $36,016 million in the same quarter last year to $40,373 million in this quarter. And finally, diluted earnings per share increased 16.0% YoY from $1.88 in Q1/23 to $2.18 in Q1/24.
Shifting Towards Services
Under Tim Cook, Apple is continuing to shift more and more towards service sales. In an article published about two years ago, I already explained how Apple is widening its moat due to focusing on service sales.
In the last quarter, service sales accounted for $23,117 million and compared to a total revenue of $119,575 it is accounting for 19.3% of total revenue. Compared to the previous quarter, service sales increased 11.3% year-over-year and was the best performing category for Apple (ahead of iPhone sales). And while service sales were accounting only for 19.3% in the last quarter, they made up 22.2% of total sales in fiscal 2023 and Apple was constantly able to increase service sales over the years and they are playing a more and more important role for overall revenue.
Author’s work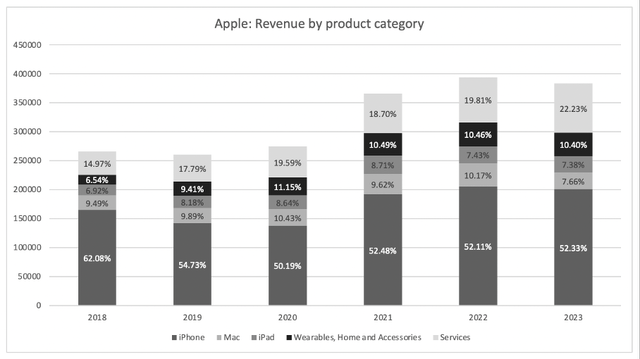
In my previous article I also explained why service sales are rather leading to an economic moat – compared to hardware sales:
Service sales are including revenue from the app store, Apple music, Apple Pay or Apple TV+ and these sales can be seen as more consistent than iPhone sales as we are dealing with subscription models, and this is leading to more consistent revenue streams. And it might also help iPhone sales to be more consistent. If I have paid for several apps, maybe use Apple Music (although there are many other similar providers to which I can switch) and have stored my data in Apple’s cloud, the incentive is much higher to buy an iPhone again to be able to use the services in a similar way.
And I also describe the resulting switching costs that are arising and are contributing to the widening moat:
These switching costs are also increasing as Apple is selling more and more additional hardware devices. Sales from “Wearables, Home and Accessories” increased from 6.54% of total sales in 2018 to 10.49%. And customers who own not only an iPhone, but also a Mac and Apple Watch or Apple TVs are less likely to switch away from the Apple ecosystem. And the Apple ecosystem is also the key to its (wide) economic moat. The better the ecosystem, the higher the incentives to stay within the ecosystem. Switching costs are getting higher and higher when several services and products are embedded in such a way, that I can use them only in a reasonable way when I keep all these products.
Hardware Sales
And while Apple is seeing its service sales increasing with a solid pace in the last few years (services sales increased with a CAGR of 16.5% in the last five years), hardware sales were not great in the first quarter of fiscal 2024 as well as in 2023. And as hardware sales are still responsible for the biggest part of revenue this can be problematic.
In 2023, all four hardware categories had to report declining sales with iPhone sales declining only 2.4% YoY and sales for Mac declining 26.8% YoY. In the first quarter of fiscal 2024 the picture was a little different. While iPhone sales increased 6.0% year-over-year and Mac sales increased 0.6% YoY, sales for iPad and Wearables declined. In total sales for products were stable year-over-year.
And while Tim Cook led the company towards higher services sales and therefore widening Apple’s moat (that was rather narrow before), he is often criticized for Apple being less innovative than under Steve Jobs. When considering that fact that 2023 was the first year without any new iPads since 2010, we can understand the criticism. The last refresh for the iPad and iPad Pro was announced in October 2022 and not surprisingly, Apple saw huge declines for iPads shipped in the fourth quarter. The company is still clear market leader with about 40% market share but year-over-year the company from Cupertino lost market shares to its competitors.
IDC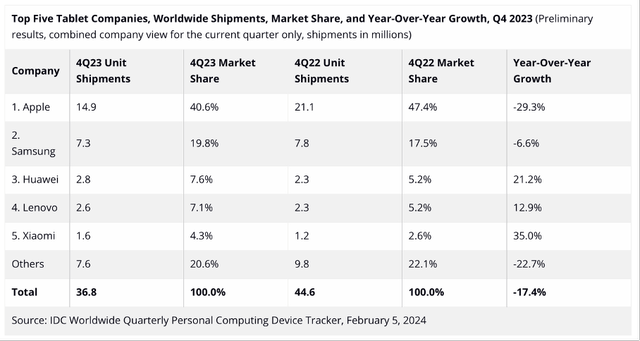
When looking at the full year shipments, however, Apple’s market share is remaining flat around 38% and shipments for tablets declined about 20% for Apple – in line with the overall market.
When looking at PC shipments in the last year, Apple also underperformed the market. For the full year shipments declined from about 27.9 million in 2022 to 21.7 million in 2023 resulting in a decline of 22.4% while overall shipments declined only 13.9%. And especially in the fourth quarter (holiday season) the problem became obvious. While the overall shipments declined only 2.7%, Apple saw its shipments decline 18.4% and was the worst performing among the top five companies.
IDC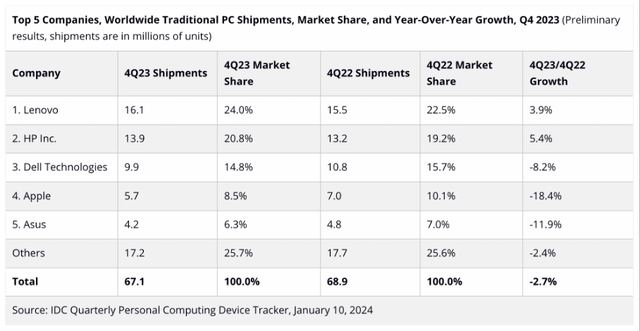
And as long as we are talking about hardware, we should also mention that Apple pushed Samsung from the smartphone throne and sold the most smartphones worldwide in 2023. This was mostly due to the underperformance of Samsung in 2023 and not so much due to the outperformance of Apple. Nevertheless, Apple could increase the number of shipped smartphones 3.7% year-over-year while the overall market reported a decline of 3.2%.
IDC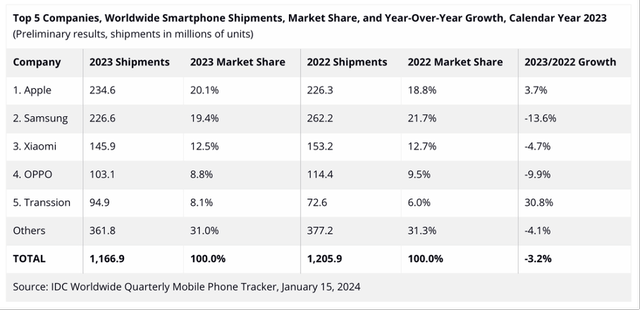
Apple also took the top spot in the Chinese smartphone market for the first time – despite challenges in the region.
China Continuously Challenging
One of the problems Apple is facing right now are the declining sales in China. But this is certainly not a problem only Apple is facing. And this struggle in China is not so much the problem of Apple as it is rather a problem in China. In Q1/24, sales in China declined to $20,819 million from $23,905 million in the same quarter last year – resulting in 12.9% year-over-year decline.
And although the weak results are probably nothing Apple is responsible for, it is still a problem Apple must deal with as China is responsible for about 20% of Apple’s total revenue and hence an important market. China is clearly in a bear market and in an economic slump (to avoid the term recession) and after the collapse of Evergrande with $300 billion in debt ripple effects throughout the economy are likely. While I think the Chinese stock market might be close to its bottom, the economy might continue to suffer a bit longer (as the stock market is always a leading indicator).
When looking at data from the IMF, China’s real estate sector is clearly in a downturn. Since 2020, real estate sales and real estate starts both declined about 50%. The IMF is writing:
With the property downturn in its third year, progress in downsizing the sector has been rapid in some respects. Housing starts have fallen by more than 60 percent relative to pre-pandemic levels, a historically rapid pace only seen in the largest housing busts in cross-country experience in the last three decades. Sales have fallen amid homebuyer concerns that developers lack sufficient financing to complete projects and that prices will decline in the future.
And the IMF is also projecting it will take much longer before we can see a recovery and it might take a long time before the real estate market will reach pre-crisis levels again. The combination of people losing money in the stock market, purchased real estate property being worth less, (youth) unemployment being higher and the mood being rather pessimistic is leading people to purchase less consumer discretionary goods and Apple is one of the companies experiencing the negative effects.
Another interesting question is what will happen if Trump is elected again in November 2024: Will the trade war with China return? I don’t really know what will happen, but these are scenarios we should think about.
China Today, United States Tomorrow?
While the United States are still in good condition from an economic perspective, we also must think about what might come. As I have explained in different articles, we should be prepared for a scenario that seems unlikely but could happen in the foreseeable future – the United States (and other countries around the world) sliding into a recession. We are not only having several indicators pointing towards the end of the short-term debt cycle (also called business cycle), but we are close to the end of a long-term debt cycle. In another article explaining why gold might be a good investment in the coming decade, I wrote:
When looking at the theory, Ray Dalio presented in his book Principles for dealing with the changing world order there are three “cycles” that seem to come to an end which is rather spelling doom for the globe. Not only does the long-term debt cycle seem close to completion, but the world is rather shifting from its internal and external order towards disorder on every level.
If my prediction is correct, we will enter a decade of declining asset prices (the so-called “lost decade”), a decade of deleveraging and all the negative consequences associated with that process (people spending less for example). Additionally, we will see higher unemployment rates and maybe declining wages.
And it doesn’t really matter if the next economic downturn will be a depression or “just” a recession. Apple as a company selling mostly non-essential items (or items where a purchase can easily be postponed a few quarters) will feel the consequences. I might need a new smartphone as my iPhone is already two, three or five years old – but as the risk for me losing my job is rising in a depression (or recession) and I already have to make high interest payments on my mortgage (due to higher interest rates) and my assets are worth less, I will postpone buying a new iPhone (or might chose the smartphone of a cheaper competitor).
Dividend and Share Buybacks
Apple declared a dividend of $0.24 in the previous quarter and after four quarters of the same dividend in a row we can expect the next dividend increase in the coming quarter. But the dividend is probably not the reason for anyone to invest in Apple as the dividend yield is only 0.52% and Apple grew its dividend only 6.15% in the last five years (and is therefore neither a good dividend growth investment).
Apple was rather focusing on share buybacks in the last few years. While Apple was spending about $14 billion to $15 billion annually on dividend payments in the last five years, the company spent between $69 billion and $95 billion annually on share buybacks in the last five years.
|
2019 |
2020 |
2021 |
2022 |
2023 |
|
|---|---|---|---|---|---|
|
Free cash flow |
$58,896 |
$73,365 |
$92,953 |
$111,443 |
$99,584 |
|
Dividend |
$14,119 |
$14,081 |
$14,467 |
$14,841 |
$15,025 |
|
Share Buybacks |
$69,714 |
$75,992 |
$92,527 |
$95,625 |
$82,981 |
In the last five years, Apple spent more money on dividends as well as share buybacks than it generated in free cash flow. In the last five years, Apple spent 112% of the generated free cash flow or to put it a little bit differently, Apple spent about $53 billion more on dividends and share buybacks than it generated in free cash flow.
But at this point, Apple still has $40,760 million in cash and cash equivalents on its balance sheet as well as $32,340 million in marketable securities and in my opinion, management can use a bigger part of these very liquid assets for share buybacks – at least in theory. Management should still think about how it is using the free cash flow it is generating most effective and share buybacks should only come into play when the stock is not overvalued.
Intrinsic Value Calculation
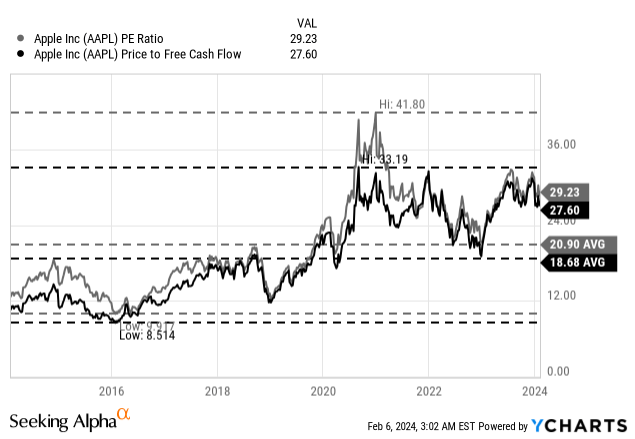
At the time of writing, Apple is trading for 29.2 times earnings as well as 27.6 times free cash flow. And at least when looking at the last ten years this is one of the higher valuation multiples the stock has been trading for. And it also trades clearly above the 10-year averages (which were 18.68 for P/FCF and 20.90 for P/E).
When trying to calculate an intrinsic value by using a discount cash flow calculation, we use a 10% discount rate and are calculating with 15,577 million diluted outstanding shares. As basis for such a calculation, we can use the free cash flow of the last four quarters (which was $106,869 million). When calculating with these assumptions, Apple must grow its free cash flow slightly above 7% annually for the next ten years followed by 6% growth.
How realistic are these growth assumptions? At this point, I would argue that Apple is fairly valued. And of course, Apple struggled in 2023 but when looking at the last few years, we can assume Apple to grow its free cash flow 7% annually. We should not forget that Apple is generating about $100 billion in free cash flow it can in theory use for share buybacks. With a market capitalization of $2.87 trillion, this is enough to repurchase about 3.5% of outstanding shares and the company will grow just by using share buybacks about 3.5% annually.
Conclusion
But despite me arguing that Apple could be fairly valued, I still would be cautious about an investment as I can also see a scenario of Apple’s sales stagnating or declining in the United States as well. And we certainly should not look at the last recession for comparisons as Apple was in a phase of explosive growth at that point in time.